
December 3, 2025
April 8, 2026
What KPIs Matter Most for Seed-Stage Startups?

What KPIs Matter Most for Seed-Stage Startups?
Most founders who fail to reach Series A did not run out of product. They ran out of signal.
The metrics a seed-stage startup needs to survive and graduate are fundamentally different from those required at $1M ARR. The "Stage Mismatch Problem" occurs when founders pick a dashboard early and fail to recalibrate as the company evolves.
- Pre-PMF: You need immediate, qualitative feedback loops.
- Post-PMF: You need repeatable, defensible unit economics.
- Series A: You need automated systems that surface data without founder intervention.
Phase 1: Pre-PMF
Minimal Structure and Fast Feedback Loops
Before Product-Market Fit (PMF), metrics should accelerate learning, not just summarize performance.
1. The Core Metric: Retention Cohorts
The single most revealing KPI is the shape of your user retention curve.
- The Decay: If the curve drops to zero, users aren't finding sustained value.
- The Flattening: If the curve flattens (even at a low percentage), you have found a "leaky bucket" that can eventually be mended. This is the first true signal of PMF.
2. Secondary Signals
- Engagement Depth: Are users completing "core workflows" (the features they can't live without) or just logging in?
- NPS Direction: At this stage, the trend of your Net Promoter Score matters more than the absolute number. Use it as a sorting mechanism to talk to unhappy users.
Common Pitfall: Tracking revenue too early. Early "social capital" revenue from friends or warm intros can mask a lack of true product demand.
Phase 2: Post-PMF to Series A
Repeatability and Unit Economics
Once the bucket holds water, the question shifts to: Can we acquire customers at a price that makes sense?
Financial Baseline: MRR and ARR
- MRR (Monthly Recurring Revenue): Monthly snapshot of subscription value.
- ARR (Annual Recurring Revenue): MRR × 12.
- The Rule: Never include one-time fees (setup, services) in these numbers.
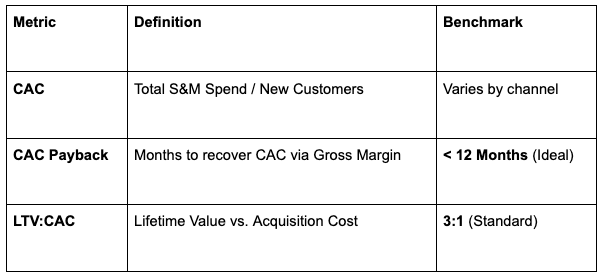
Efficiency Metrics: CAC and Payback
Net Dollar Retention (NDR)
NDR measures if your existing base is growing.
- 100% NDR: You are replacing churn with expansion.
- 120%+ NDR: Best-in-class; you can grow without adding a single new customer.
Phase 3: Series A and Beyond
Automation and System Design
At this stage, the founder transitions from executor to system designer. The business must surface signals automatically.
- Gross Margin: Aim for 70-80%. Lower margins imply pricing inefficiency or high service delivery costs.
- Burn Multiple: (Net Burn / Net New ARR).
- Strong: < 1.5
- Inefficient: > 2.0
- The Dashboard: Your analytical responsibility is now building a source of truth that board members can read without a "guided tour."
The Audit Checklist: 15 Diagnostic Questions
- Retention: Are you tracking daily activities before confirming core workflow completion?
- Clean Data: Does your MRR include one-time setup fees?
- Payback: Is your CAC payback calculated using gross margin, not gross revenue?
- History: Do your cohorts go back at least 12 months?
- Assumptions: Are your LTV churn assumptions stated explicitly?
- Knowledge: Can you state your NDR right now?
- Segmentation: Do you know the CAC for each channel separately?
- Recalibration: Have you updated your dashboard in the last 6 months?
- Ownership: Does every metric in your deck have a clear owner?
- Efficiency: Are you tracking Burn Multiple?
- Prioritization: Which single metric would impact your next fundraise most if improved by 20%?
- Utility: Are your metrics producing decisions or just a "sense of activity"?
- Runway: Have you mapped the relationship between CAC and remaining cash?
- Independence: If you stopped looking at metrics for 30 days, would performance change?
- Due Diligence: Does your dashboard answer the first 15 minutes of an investor meeting?
Metrics are a decision tool, not a scoreboard. If a number doesn't change your behavior, stop tracking it.