
September 25, 2025
7 min read
April 24, 2026

Most early-stage SaaS founders track the wrong leading indicators. They watch pipeline value as a proxy for future revenue. They watch the number of open deals. They hold weekly calls asking reps why this or that prospect has gone quiet. All of these activities feel productive. Almost none of them produce actionable intelligence.
Sales velocity changes that equation entirely.
Sales velocity is a single composite number that measures how much revenue a sales team generates per unit of time. It combines four independent variables; number of qualified opportunities, average deal size, win rate, and average sales cycle length, into one output that describes the real speed of a company's revenue engine. Founders who track it weekly see the problem before the quarter closes. Founders who ignore it often discover the problem in the board report, when it is too late to course-correct.
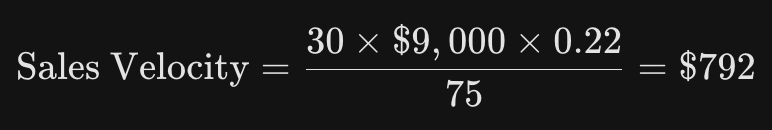
The formula is straightforward:

The output is a dollar-per-day figure. A team with 40 qualified opportunities, an average deal value of $10,000, a 25% win rate, and a 60-day average sales cycle produces a sales velocity of approximately $1,667 per day. That number, tracked over time, tells a more complete story than any individual pipeline snapshot.
What makes sales velocity valuable is not the number itself. It is the ratio. When velocity declines, one or more of the four inputs has degraded. The founder can isolate which variable moved, run the right diagnostic, and apply the right fix. Without velocity, the founder is inspecting a car that will not start by kicking the tires. The problem is real. The diagnostic is useless.
For early-stage teams specifically, sales velocity serves a second function; it disciplines forecasting. Investors and board members consistently ask early SaaS founders to explain why a deal closed or why it did not. Sales velocity provides a principled answer rooted in process, not circumstance. A team with tracked, benchmarked velocity can say: "Our average sales cycle is 45 days. This deal has been open 90 days and has not reached the technical evaluation stage. It carries a 12% close probability, not 80%." That is the kind of operating precision that separates teams that scale from teams that stall.
There is a pattern in early SaaS revenue operations that appears in virtually every company between $0 and $2M ARR. The founding team closes the first customers through relationships, speed, and founder-led selling. Win rates are high. Sales cycles are short, because the founder can make every decision on the spot. Average deal sizes are negotiated deal by deal, often without a price anchor.
Then the team hires its first account executive. Or the founding team starts selling to customers they did not already know. Suddenly, win rates drop. Sales cycles stretch. Average deal sizes fall below expectations because reps discount to close. Pipeline grows on paper but revenue does not follow.
A team that tracked sales velocity from the beginning would have seen all four of those shifts individually. A team that did not track it discovers the compound damage months later, usually in a board meeting or a cash flow review.
The diagnostic value of velocity is highest when it is established early, because then any deviation signals a real change in go-to-market performance rather than a baseline measurement artifact. Velocity, benchmarked from the first 20 deals, gives the team a reference point that no industry report can replicate, because it is calibrated to the team's specific market, motion, and buyer profile.
Understanding the formula is necessary. Understanding how the four variables interact is what separates a team that monitors velocity from one that uses it to make decisions.
This variable counts only opportunities that meet a defined qualification standard. In founder-led sales, this threshold is often informal. In a maturing team, it is codified; a MEDDIC-qualified deal, or a deal where the champion, budget, timeline, and decision process have been confirmed.
The distinction matters enormously for velocity. If a team counts every CRM record with "Opportunity" status, the number of opportunities inflates and velocity appears healthy. Win rate then drops because the denominator grows with unqualified deals. Sales cycle length stretches because the team is working deals that will never close. The entire metric collapses into noise.
Qualified opportunity count is the clean filter that makes the other three variables meaningful. It requires a written qualification definition that every team member applies consistently.
At the early stage, a lightweight version of MEDDIC. Identifying the Metric (the buyer's financial problem), Economic Buyer (the person who controls the budget), Decision Criteria, Decision Process, and Champion. Is sufficient to distinguish real opportunities from pipeline theater.
Average deal value, often expressed as Annual Contract Value (ACV) for subscription businesses, reflects the average size of a closed deal in a given cohort. It is not the average size of open opportunities. It is the average size of closed-won deals.
This variable has two common failure modes at the early stage. The first is discounting pressure. A rep facing end-of-quarter pressure offers a 30% discount to close. The deal that enters the CRM as a $12,000 ACV closes at $8,400. Over 20 deals, this pattern shaves $72,000 off annual revenue and permanently depresses the average deal value benchmark.
The second failure mode is tier confusion. When a startup launches without defined pricing tiers, each deal becomes a custom negotiation. Some are close to large. Most are small. The average obscures the fact that there is no coherent pricing strategy, and the velocity metric absorbs the variance without explaining it.
High-performing early SaaS teams anchor their average deal value by publishing written pricing, defining the conditions under which discounts are permitted, and requiring management approval for any concession above 10%.
Win rate is the percentage of qualified opportunities that close as won within a defined period. The correct denominator is qualified opportunities, not all opportunities. An early-stage team with 40 qualified deals that closes 10 has a 25% win rate. A team that puts 100 unqualified deals in the funnel and closes 10 has a 10% win rate. But the 10 closed deals are not evidence of 10% pipeline efficiency. They are evidence that 90 deals were never real.
Win rate below benchmark almost always points to one of three problems; the team is pursuing the wrong buyer profile (ICP misalignment), the product demo is not connecting to buyer pain, or the team is losing to "no decision" rather than to a competitor. Research from the Harvard Business Review found that 40% to 60% of B2B deals are lost to customer inaction, not competitive displacement.
Sales cycle length measures the average number of days from opportunity creation to closed-won or closed-lost. It is not the number of days a deal has been open. It is the completed average across all deals, including losses, within a defined period.
This variable is the one that early teams manipulate most often, usually by accident. When a deal has been open for 120 days and shows no signs of closing, reps update the close date rather than marking the deal lost or returning it to an earlier stage. This artificially extends the average sales cycle in the CRM without any corresponding real-world change in buying behavior.
The result is a distorted average that makes the sales motion look slower than it actually is for deals that are progressing. Velocity drops. The team cannot tell whether the slowdown is a process problem or a pipeline hygiene problem.
The four variables interact multiplicatively in the numerator and divisively in the denominator. This means a small improvement in each variable produces a larger gain than a large improvement in any single one.
Consider a team with the following baseline:
Now the team improves each variable by 15%:

A 15% improvement in each lever produces a 79% improvement in overall velocity. This is the compounding effect that makes velocity a uniquely powerful optimization target.
Knowing the formula and the benchmarks is not enough. The operating system that generates reliable data is what makes velocity useful.
Before any velocity tracking is meaningful, the team needs a written qualification definition that all sellers apply consistently. It does not need to be elaborate. It needs to be precise.
Sales velocity is only as accurate as the data behind it. CRM hygiene is not a nice-to-have. It is the foundation. This protocol eliminates the two most common data distortions; inflated pipeline from zombie deals and suppressed win rates from unqualified opportunities.
Monthly velocity calculations are too slow for early-stage companies. A deal that closes two days into the next reporting period disappears from the denominator but not the pipeline, producing a false velocity drop. Weekly calculations smooth this effect and give the team a more accurate picture of real-time revenue engine health.
Each variable in the velocity formula responds to a different set of interventions. The diagnostic question is; which lever is most below the benchmark?
Industry benchmarks provide a reference point, but the most useful velocity target is one calibrated to the team's own history.
[ ] Export the last 90 days of closed-won and closed-lost deals from the CRM
[ ] Calculate the current baseline velocity using the formula
[ ] Compare each variable to stage-appropriate benchmarks
[ ] Identify the single variable with the largest gap from benchmark
[ ] Assign one owner and one specific intervention to that variable
[ ] Set a weekly velocity calculation calendar event
[ ] Define and document the qualification criteria for active pipeline
[ ] Audit all current open opportunities against the written qualification standard
[ ] Remove or recategorize any deals that do not meet the criteria
[ ] Recalculate velocity with the cleaned pipeline
[ ] Run win-loss analysis on all deals closed in the period
[ ] Identify the top three reasons for lost deals
[ ] Build one targeted intervention for the most common loss reason
[ ] Review average deal size trend. Is it stable, rising, or declining?
[ ] Review discount frequency.
[ ] Build a mutual action plan template for all qualified deals
[ ] Review stage-duration data. Identify the highest-friction stage in the funnel
[ ] Compare current velocity to the 90-day baseline. Document the delta and the primary driver.